-
2023’s Best Cities to Eat Local Food

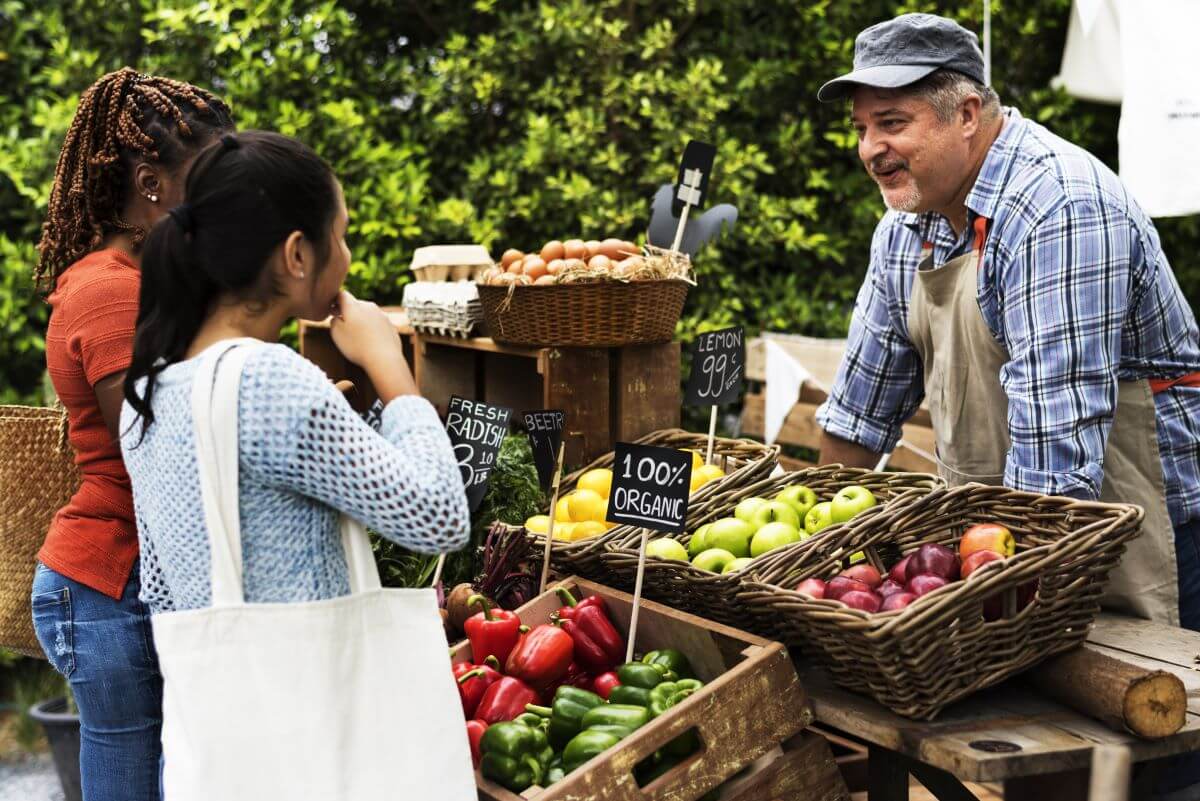
Where in America can you easily find farm-fresh food?
To mark National Small Business Week starting April 30, LawnStarter ranked 2023’s Best Cities to Eat Local Food, compared the 200 biggest U.S. cities based on three categories.
LawnStarter looked for cities with great access to community-supported agriculture (CSAs), u-pick farms, local dairy farms, and on-farm markets. LawnStarter also considered the number of local food movement groups, among 17 metrics. Dig into our ranking below. To learn how LawnStarter ranked the cities, see our methodology.

Top 5 Close Up
Check out the slideshow below for highlights on each of the top five cities.

No. 1: Portland, Oregon | Overall Score: 51.30
Access: 1
Convenience: 2
Support: 27Local Tips: Laughing Planet Cafe uses local ingredients to craft globally inspired takes on burritos, soups, and salads.
With 40 locations across the Portland metro, Burgerville makes it easy to chomp down on fast food favorites with local origins.
For fancier fare, check out the seasonal menu at Arden, or book a table at “reverse steakhouse” G-Love.
Photo Credit: BXXXTY / Pexels / Pexels License

No. 2: Baltimore | Overall Score: 47.61
Access: 10
Convenience: 1
Support: 2Local Tips: Baltimore supports farmers and locavores through the city’s Homegrown Baltimore initiative.
Residents can explore local options on the Baltimore Foodshed map.
Maggie’s Farm is a favorite farm-to-table spot for locals. Another option is Gertrude’s, which serves up a Chesapeake-inspired menu inside the Baltimore Museum of Art.
Photo Credit: Styves Exantus / Pexels / Pexels License
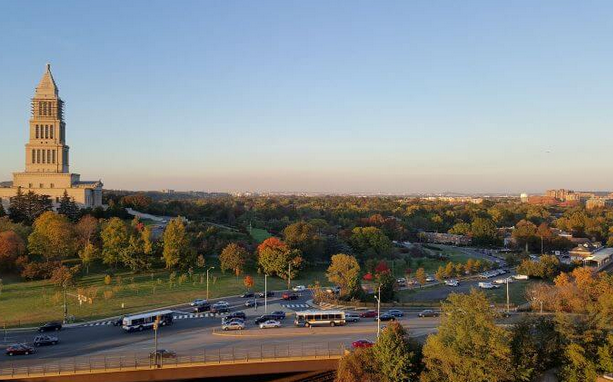
No. 3: Alexandria, Virginia | Overall Score: 47.5
Access: 2
Convenience: 18
Support: 4Local Tips: Have a Parisian outing in Old Town Alexandria with a locally sourced meal at Bastille Brasserie & Bar.
Dine in an 1800s granary converted into an American-style tavern with seasonal fare at Virtue Feed & Grain.
Photo Credit: ALXCHO / Wikimedia Commons / CC BY-SA 4.0
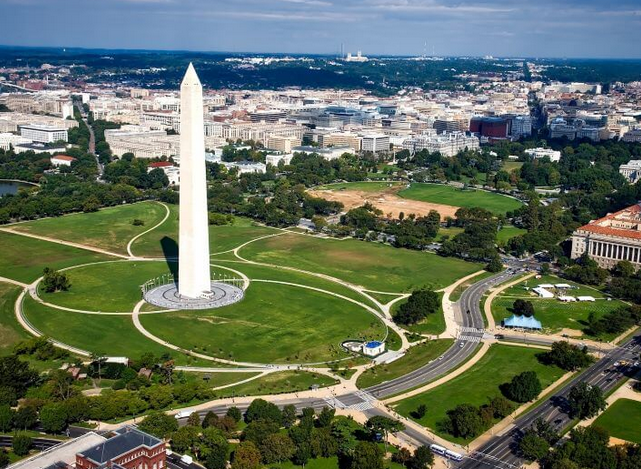
No. 4: Washington | Overall Score: 43.03
Access: 13
Convenience: 26
Support: 1Local Tips: Shop at a grocery store filled with local products at Dawson’s Market.
Find fresh and sustainably sourced ingredients at one of six Clyde’s locations across the DC metro area.
Discover other restaurants with a “Snail of Approval,” designated by Slow Food D.C.
Photo Credit: Pixabay / Pexels / Pexels License
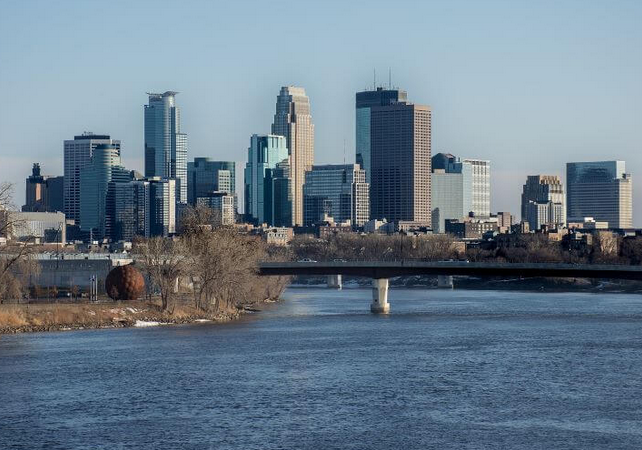
No. 5: Minneapolis | Overall Score: 41.93
Access: 8
Convenience: 4
Support: 50Local Tips: The city of Minneapolis encourages local dining through the Homegrown Minneapolis initiative.
Find local products and farm-to-table restaurants with the help of directories like Minnesota Grown and Minnesota Cooks.
Top spots for locavores include Wise Acre, The New York Times-approved Petite León, and Spoon and Stable, led by a James Beard Award-winning chef.Photo Credit: BpA9543 / Wikimedia Commons / CC BY-SA 4.0
Farm-to-Fork: Key Insights
The Gist
Eating local is popular and convenient in many large cities along the Atlantic and Pacific coasts. Locavores also can thrive in Midwestern cities like Minneapolis (No. 5) and Madison, Wisconsin (No. 8), thanks to high access to community-supported agriculture and local farms offering delivery.
Many Texas cities fall behind in access to locally sourced food. Only six Lone Star cities place in the top half of our ranking: Austin (No. 54), Dallas (No. 63), McKinney (No. 77), Plano (No. 79), Denton (No. 94), and Frisco (No. 97). Meanwhile, seven Texas cities land in the bottom 10 — just behind Anchorage, Alaska, in last place.
Standout Stats
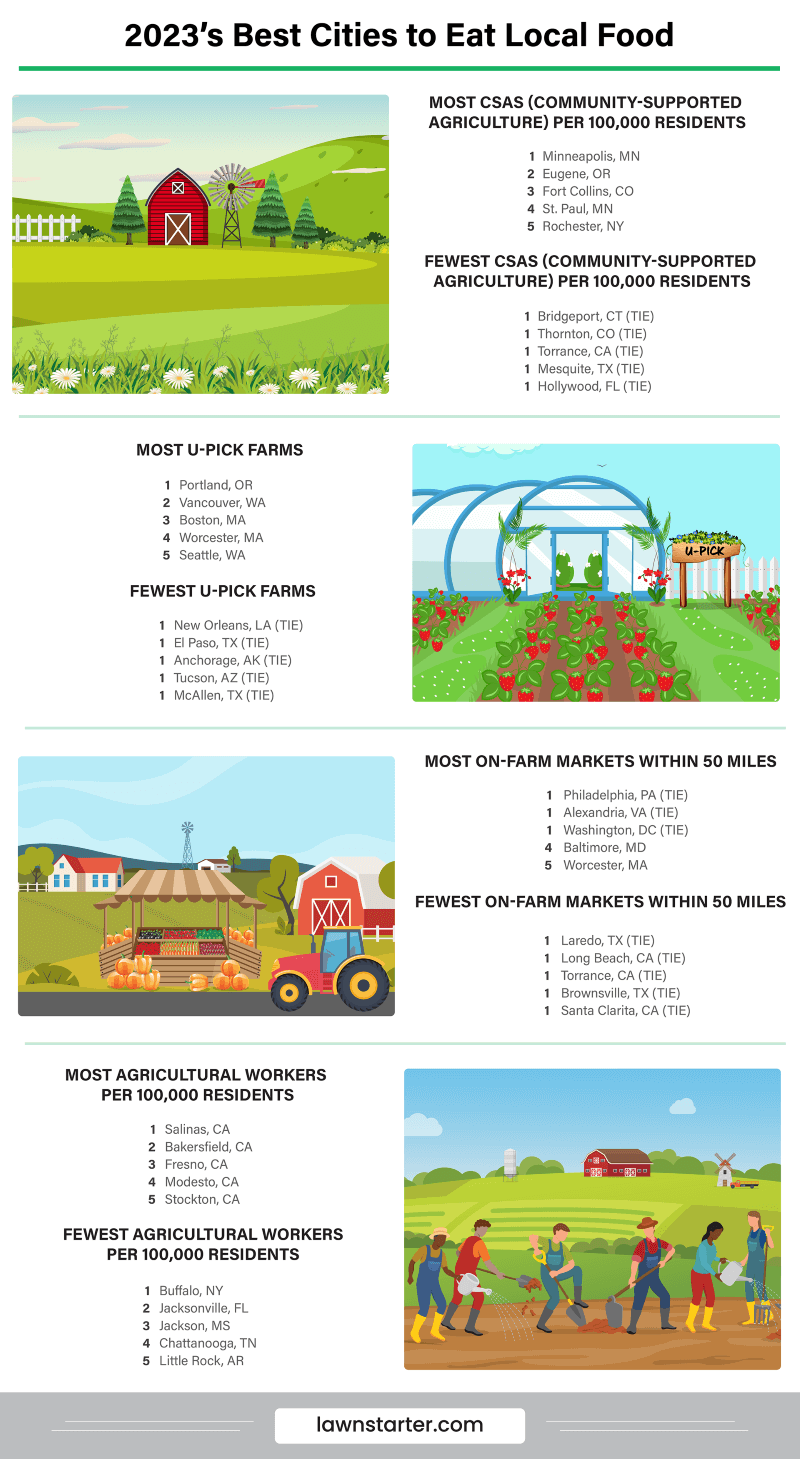
- Land of Locavores: It’s no secret that Portlanders love local food. Portland, Oregon, takes first place overall with the best Access to local eats and the highest number of u-pick farms. The City of Roses also offers a high number of farm stands, on-farm markets, and craft breweries per square mile.
- Atlantic Eats: Mid-Atlantic cities Baltimore (No. 2), Alexandria, Virginia (No. 3), and Washington (No. 4), sprout to the top of our ranking with high Access and Support for eating local. Alexandria and Washington tie with Philadelphia (No. 21) for the most on-farm markets within 50 miles. Baltimore boasts the best Convenience with the second-highest number of both on-farm pickup and delivery options. All three cities have Buy Fresh Buy Local chapters, too.
- Pick Your Own: Cities in the Northeast and Northwest grow plenty of options for picking your own produce at farms. Portland (No. 1) leads the way, followed by Vancouver, Washington (No. 10), Boston (No. 7), Worcester, Massachusetts (No. 11), and Seattle (No. 6) in u-pick farm access.
- Fast (Fresh) Food: Eating local doesn’t need to be inconvenient in Madison, Wisconsin (No. 8), where locals devour the most options for food delivery directly from farms. Baltimore (No. 2), Portland, Oregon (No. 1), Louisville, Kentucky (No. 39), and St. Paul, Minnesota (No. 15), all tie for second place in this metric with a handful of other cities.
- From Seed to Salad: Community-supported agriculture (CSA) programs are a popular and convenient way to access farm-fresh food — especially in Minneapolis (No. 5), which has the most CSAs per 100,000 residents. Eugene, Oregon (No. 42), produces the second-highest number of CSAs per capita.
You May Also Like

Wilt Guilt No More with Gourmet Garden
-
San Diego is the No. 8 Best City for Brunch Lovers

Where in the U.S. can you get top-tier brunch with bottomless mimosas?
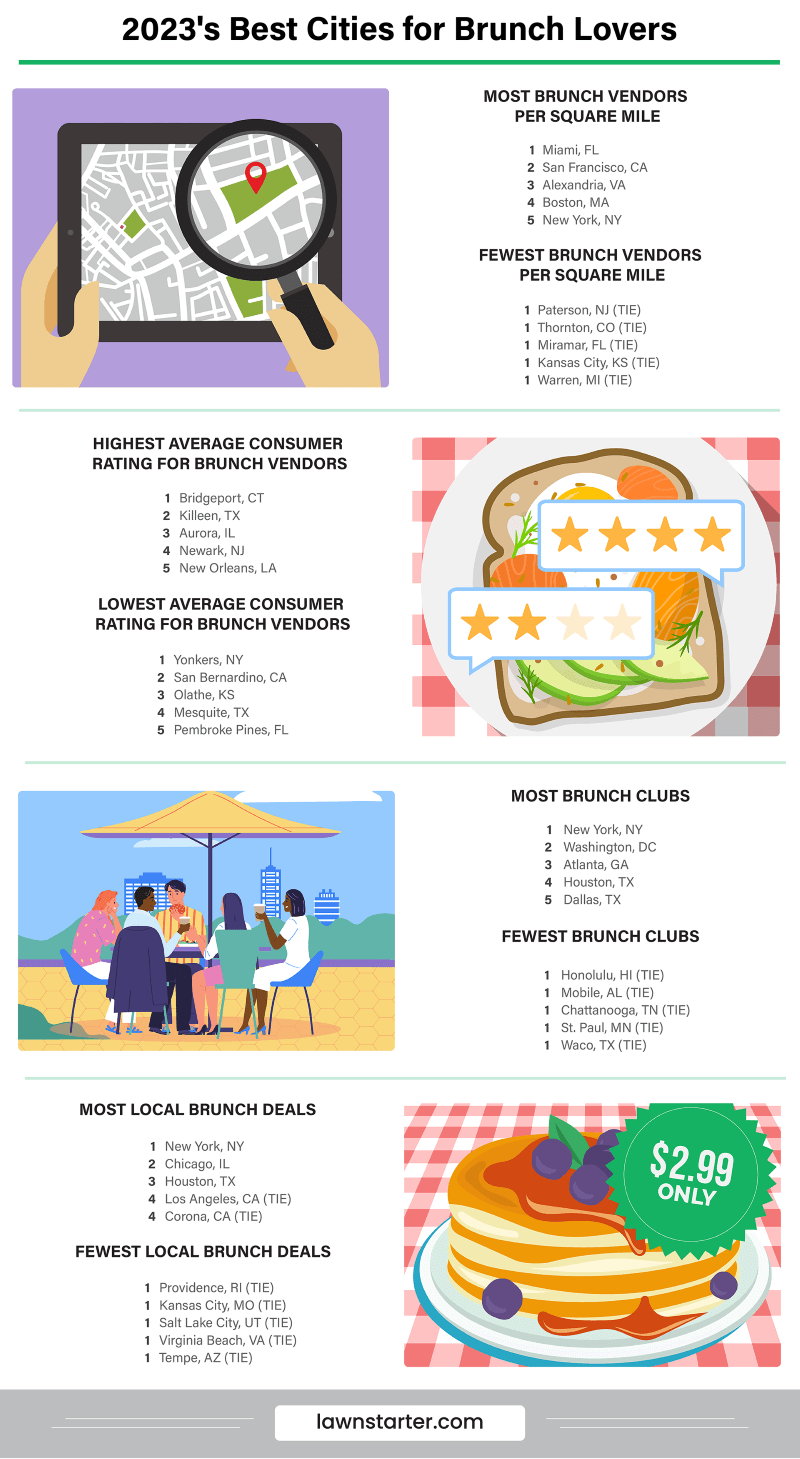
LawnStarter got you covered with 2023’s Best Cities for Brunch Lovers. To mark National Brunch Month in April, LawnStarter compared the 200 biggest U.S. cities based on five categories broken down into eight metrics. They looked at brunch deals, brunch clubs, and brunch vendor quality to name a few.
How does San Diego stack up?
San Diego’s Rank in Some Key Metrics (1st = Best)
- Number of Local Brunch Deals – 8th
- Average Consumer Rating for Brunch Vendors – 10th
- Number of Brunch Clubs – 7th
- Number of Brunch Events – 16th
- Average Monthly Google Searches for Brunch-Related Keywords Over Past Year – 13th

Top 5 Close Up
Check out the slideshow below for highlights (and lowlights) on each of the top five cities.

No. 1: New York | Overall score: 70.59Access: 3
Quality: 75
Community: 1
Events: 2
Demand: 1Local tips: Combine the best of dining and entertainment with an intimate jazz brunch at one of NYC’s most romantic restaurants, One if by Land, Two if by Sea. You can also book a table to enjoy brunch and a drag show at Lucky Cheng’s. For a hearty Southern breakfast, head to Jacob’s Pickles.
Photo credit: Roberto Vivancos | Pexels | Pexels License

No. 2: San Francisco | Overall score: 49.80 Access: 2
Quality: 19
Community: 10
Events: 20
Demand: 5Local tips: Enjoy farm-to-table fare at plow or baked goods and breakfast sandwiches at Devil’s Teeth Baking Company. Indulge in bottomless mimosas and beer on Saturdays at Best Kept Secret.
Photo credit: Kehn Hermano | Pexels | Pexels License
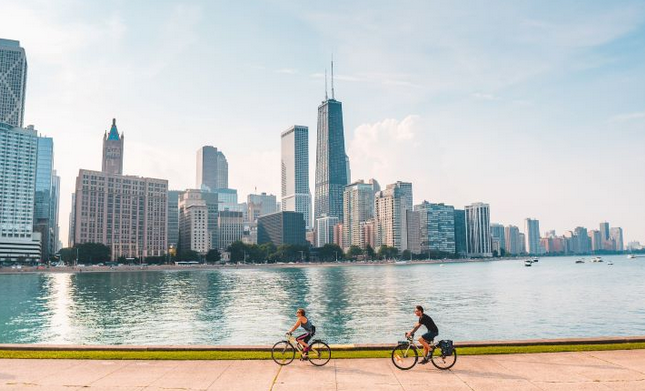
No. 3: Chicago | Overall score: 47.13 Access: 7
Quality: 18
Community: 6
Events: 6
Demand: 2Local tips: Find delightful brunch dishes like maritozzi, beet bruschetta, and smoked trout scramble at Lula Cafe. Get a comforting bite at Honeybear Cafe, which offers a varied menu including biscuits, grits, chilaquiles, breakfast skillets, and eggs benedict.
Photo credit: Chait Goli | Pexels | Pexels License

No. 4: Denver | Overall score: 45.89 Access: 20
Quality: 21
Community: 15
Events: 1
Demand: 10Local tips: Pair bottomless blood orange and classic mimosas with eclectic entrées at Root Down. Find more innovative eats at Mimosas, which has a menu boasting 15 mimosa flavors (plus one alcohol-free option).
Photo credit: Arpan Parikh | Pexels | Pexels License
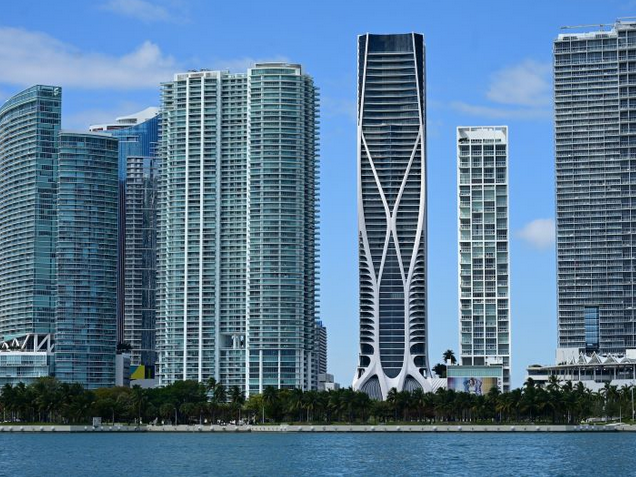
No. 5: Miami | Overall score: 41.72 Access: 1
Quality: 125
Community: 42
Events: 47
Demand: 15Local tips: Taste Southern comforts with an Italian flair at Rosie’s. For a bit of French fare, head over to Café Bastille, which offers bottomless mimosas all day, every day.
Photo credit: Tory Brown | Pexels | Pexels License
You May Also Like

Little Box of Happy – My Little Mascara Club
-
2023’s Best Cities for Crafting

Love to DIY? Whether you’re a needlework novice or a full-time Etsy-preneur, 2023’s Best Cities for Crafting will bring out your inner Martha Stewart.
LawnStarter pieced together this ranking of the 200 biggest U.S. cities using 14 “crafty” metrics.
LawnStarter looked for easy access to crafting supplies, a big crafting community, workshops for learning new techniques, and plenty of crafting events to attend.
Celebrate National Craft Month this March in one of America’s DIY art capitals below, and find out why some cities’ craft scenes stand out.
How does San Diego stack up? San Diego’s Rank in Some Key Metrics (1st = Best) - Number of Arts and Crafts Supply Stores – 8th
- Number of Crafting Meetup Groups – 6th
- Number of Art Classes and Workshops per 100,000 Residents – 34th
- Number of Arts and Crafts Festivals – 9th

Highlights
Crafting Capital of America
New York might as well be called “The City That Never Stops Crafting.”
For the second year in a row, The Big Apple handily defeated its competition by dominating three out of four categories: Access, Community, and Events.
However, Gotham lacks enough art schools, classes, and workshops to formally train its enormous population — the city finished 154th out of 200 in Education.
Regardless, crafty creatives won’t struggle to find inspiration outside the classroom in America’s biggest melting pot of cultures and backgrounds.
Materialistic Cities Big and Small
In general, the biggest U.S. cities like New York, Los Angeles, and Houston fared best in LawnStarter ranking. More residents simply means more demand for creative outlets. That’s why these cities collectively showed well in Access, Community, and Events.
That’s not to say smaller cities lack creativity and can’t hold a homemade candle to those crafty behemoths.
Landing at No. 17, for example, is Rochester, New York, home to America’s oldest craft school and to world-class craft artists like sculptor Albert Paley. Richmond, Virginia, secured its place in our top 25 with its thriving craft scene. For nearly 60 years, Richmond has hosted the annual Craft + Design, a nationally attended exhibit showcasing the nation’s best contemporary crafts.
Both cities have populations under 250,000.
Meet Your Maker (at Craft Week)
Want to buy the highest-quality handmade goods or take your craft skills to the next level?
San Francisco (No. 3), Atlanta (No. 7), Baltimore (No. 13), and St. Paul, Minnesota (No. 27) are the places to be. Each of these top performers plays host to American Craft Made, an event that connects art lovers and craft hobbyists with hundreds of America’s top crafting pros.
The national event showcases crafts from all over the U.S., as well as fun and educational activities like workshops, studio tours, and “maker meetups.”
Clear your calendar to visit these handy hubs if you’re serious about your craft and want to show your appreciation for the big players in the industry.
Stitching Together the Ranking
For each of the 200 biggest U.S. cities, LawnStarter gathered publicly available data on the factors listed in the table below.
LawnStarter then grouped those factors into four categories: Access, Community, Education, and Events.
Next, LawnStarter calculated weighted scores for each city in each category.
Finally, LawnStarter averaged the scores for each city across all categories.
The city that earned the highest average score ranked “Best” (No. 1), while the city with the lowest ranked “Worst” (No. 200).
Notes:
- The “Worst” among individual factors may not be No. 200 due to ties among cities.
- “National Craft Chains” include Hobby Lobby, HobbyTown, Jo-Ann Fabrics & Crafts, and Michaels.
-
2023’s Best California Wine Counties
California is the nation’s wine garden and wine cellar, but which counties produce the most award-winning reds and whites, host the most wine tours, and are most popular and affordable for wine connoisseurs to visit?
LawnStarter pored over the data to uncork 2023’s Best California Wine Counties.
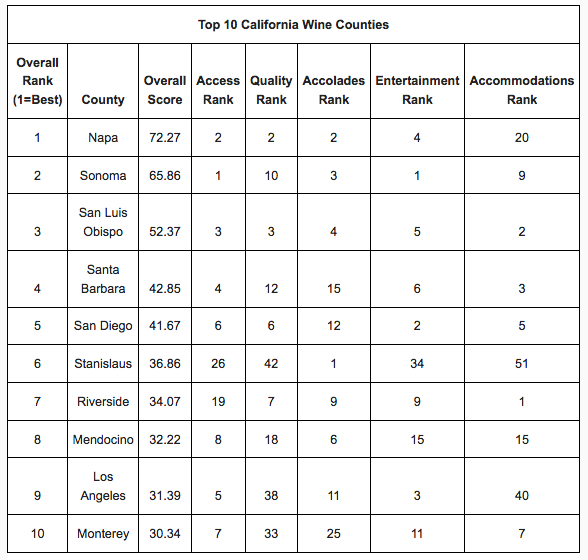
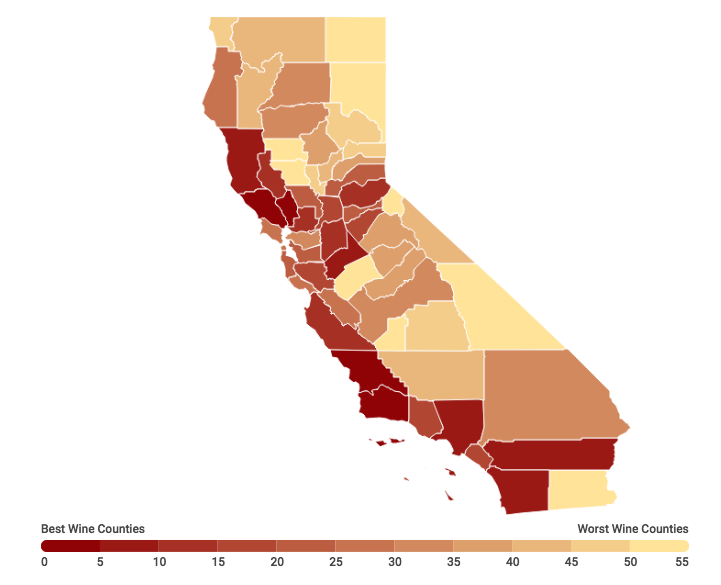
LawnStarter compared all 58 counties based on five categories broken down into 18 key metrics.
See which Golden State counties earned a gold star in our ranking below. You’ll also find highlights, lowlights, and expert insights on what makes California wines stand out.

Highlights and Lowlights:
-
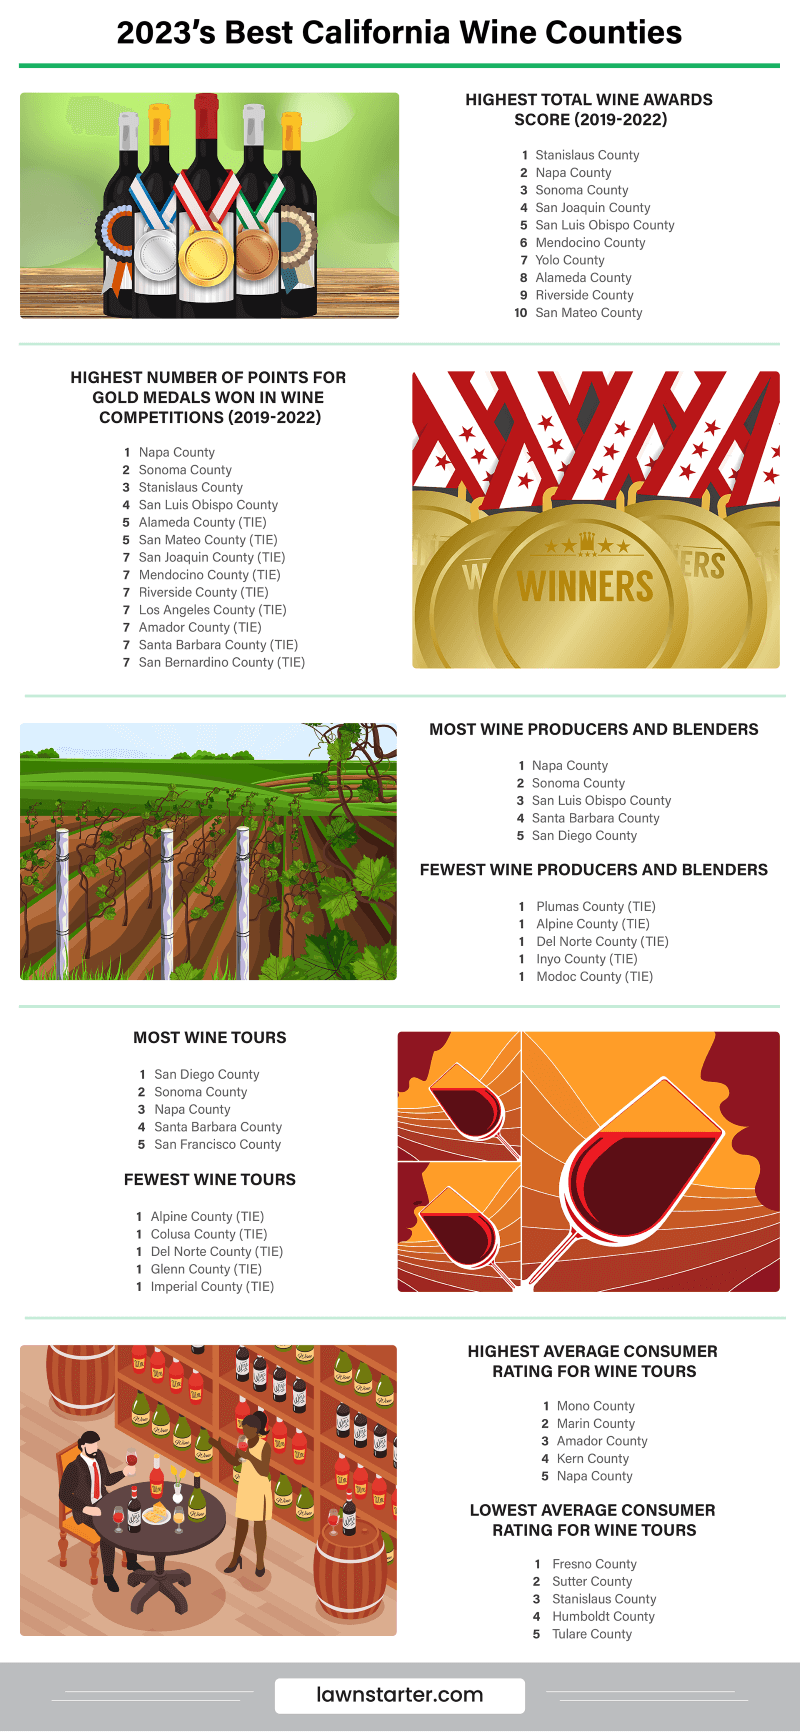
On Cloud Wine in the North Coast: Napa is our Best California Wine County again this year. You won’t go thirsty at the home of three-Michelin-starred The French Laundry. Napa outnumbers all other California counties in vintners, with nearly 270 more than Sonoma (No. 2) and 840 more than San Luis Obispo (No. 3). What’s more, Napa wines earned the most gold medals over the past four years.
It’s hard not to pair Napa with Sonoma, the next most recognizable name in California wine and unsurprisingly our silver medalist. Previously in third place, Sonoma overtook Stanislaus County in our ranking this year, thanks to Sonoma’s unmatched access to wine, numerous awards, and the most events celebrating the county’s amore for vino.
-
“Dry” Counties: The counties at the bottom of our ranking should come as no surprise — viticulture isn’t big here. Kings County finished last overall, bested by Merced, Colusa, Modoc, and Alpine counties (in that order).
These counties might lack their own famous wines, but close proximity to California’s top wine regions is a huge advantage. Merced, for example, lies just south of Stanislaus County (No. 6). Kings shares a border with both Central Region counties Monterey (No. 10) and Fresno (No. 30). Colusa is a short drive — or Uber ride, depending on how much you drink — to Napa, Sonoma, and Lake (No. 12).
-
The Grape Escape: One day is not enough to explore all of California’s amazing wines — let alone a single county saturated with wineries. If you can swing it, plan at least a three-day tour of clustered counties, and make sure your itinerary includes counties that balance both high-quality wine and (inebriated) visitor-friendliness.
Those include some of the top five, but don’t overlook counties outside of that elite group. Riverside (No. 7), for example, ranks decently in taste and placed first in Accommodations. Mendocino (No. 8) earned high marks in Access and Accolades, as well as top-15 rankings in both Entertainment and Accommodations. Placer (No. 21) is a third great option, with top-30 rankings across all categories.

Local Tips
From Northern to Southern California, there are wineries where you can sip back and taste the fruits of all that sun, rich soil, and long growing season.
-
-
San Diego is the No. 13 Best City for Pizza Lovers
 There’s no better way to celebrate National Pizza Day on Feb. 9 than by chomping down on a big pizza pie.
Which cities are serving up the best slice?
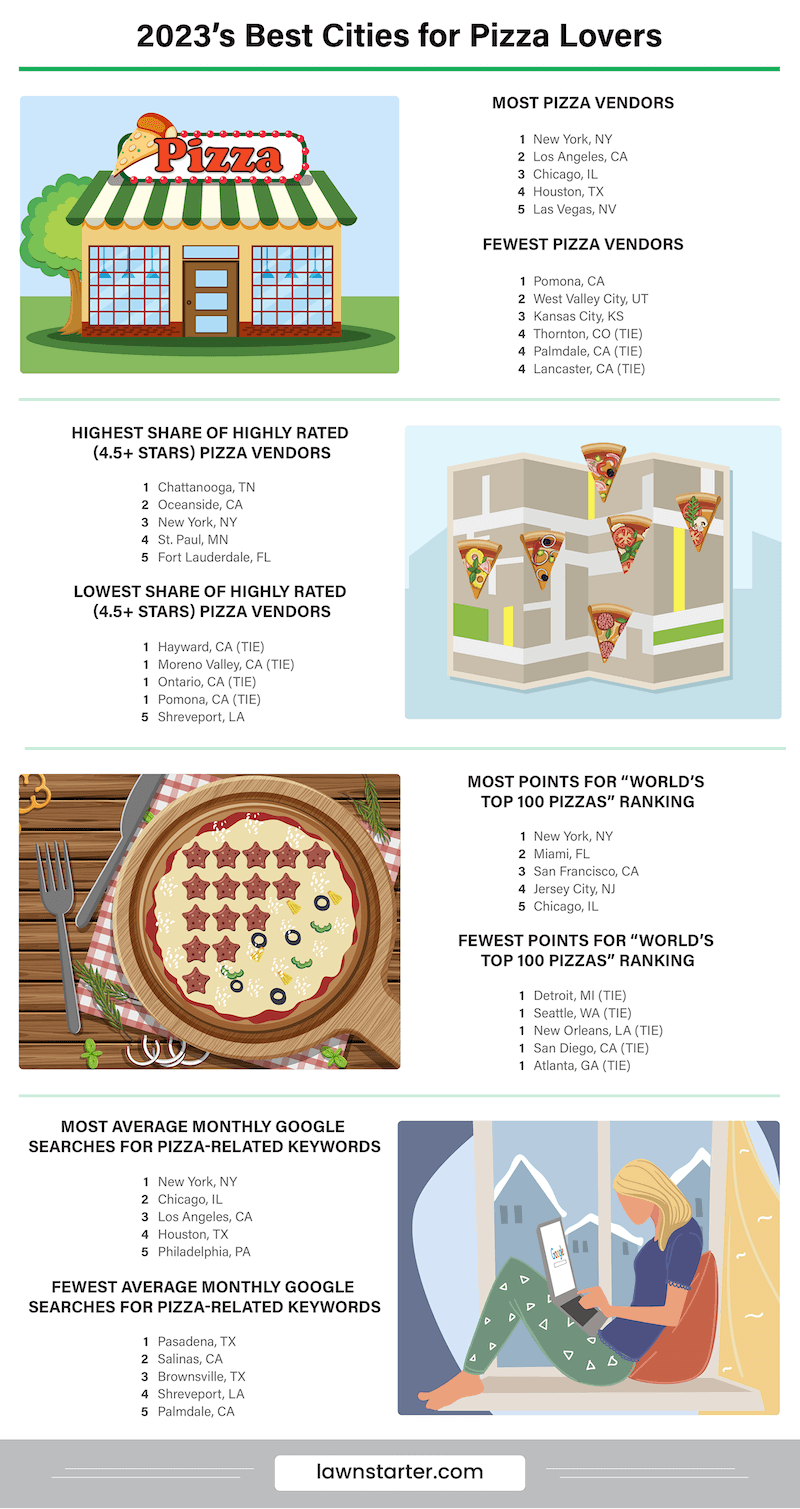
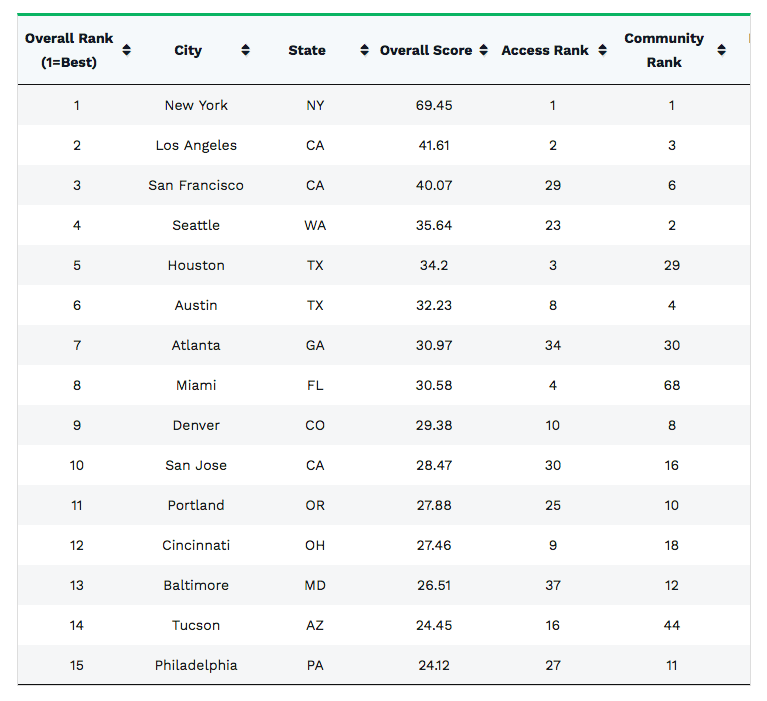
LawnStarter compared the 200 biggest U.S. cities to rank 2023’s Best Cities for Pizza Lovers.
To come up with the ranking, LawnStarter looked for cities with plenty of highly rated pizza vendors and award-winning pizzerias. LawnStarter also considered pizza affordability and popularity.

New York stands tall in first place as the capital of the Pizza Belt and the nation’s pizza empire. All competition folds in the wake of the Big Pizza, which has more than a 40-point lead over the next-best city, San Francisco.
New Yorkers might act superior about their slices, but they have good reason to. New York pizza vendors have a high average consumer rating, and they’re recognized internationally. Out of all U.S. cities, NYC had the most pizzerias included in Italy’s international pizza guide in recent years.
Italian immigrants brought pizza to New York and America at the beginning of the 20th century, but you don’t have to stay in Little Italy to find a cheesy pie. You can’t go far in NYC without encountering one of more than 1,500 pizza vendors feeding the city.
We all know Chicago (No. 3) serves iconic deep-dish pizza, but what about San Francisco (No. 2), Miami (No. 4), and Las Vegas (No. 5)?
Each of these four cities baked their way into the top five, thanks to abundant Access and numerous Accolades. San Francisco beat out Chi-town with more affordable slices (when adjusted by income) and more pizzerias recognized by international pizza awards.
If you prefer to judge pizza by consumers’ tastebuds, check out pizzerias in Chattanooga, Tennessee; Frisco, Texas; and California cities Oxnard and Chula Vista. These smaller cities stood out in Quality, with plenty of highly rated pizza vendors to pick from.
Golden State cities spread out across our ranking, with two landing in our top 10 and four in our bottom 10. While it’s easy to find a decent pie in big cities like San Francisco, Los Angeles (No. 6), and San Diego (No. 13), that’s not the case for smaller cities in California.
Unfortunately, cities like Moreno Valley, Bakersfield, and Salinas, crisped to the bottom, along with Hayward in last place. These four cities dough not offer many impressive pizzerias, with some of the lowest rankings in Quality, Popularity, and Accolades. They also knead more options: Apart from Bakersfield, these places lack pizza vendors to choose from.
For each of the 200 biggest U.S. cities, LawnStarter gathered publicly available data on the factors listed in the table below.
LawnStarter then grouped those factors into five categories: Access, Quality, Accolades, Popularity, and Affordability.
Next, they calculated weighted scores for each city in each category.
Finally, they averaged the scores for each city across all categories.
The city that earned the highest average score was ranked “Best” (No. 1), while the city with the lowest was ranked “Worst” (No. 200). (Note: The “Worst” among individual factors may not be 200 due to ties among cities.)
How does San Diego stack up?
San Diego’s Rank in Some Key Metrics (1st = Best)
- Number of Pizza Vendors – 7th
- Share of Highly Rated (4.5+ Stars) Pizza Vendors (With 10+ Reviews) – 22nd
- Total Points for “Top 50 US Pizzas” Ranking (Past 3 Years) – 26th
- Average Monthly Google Searches for Pizza-Related Keywords Over Past Year – 7th
- Average Pizza Price (as % of Average Weekly Household Income) – 44th
You May Also Like
Wilt Guilt No More with Gourmet Garden
-
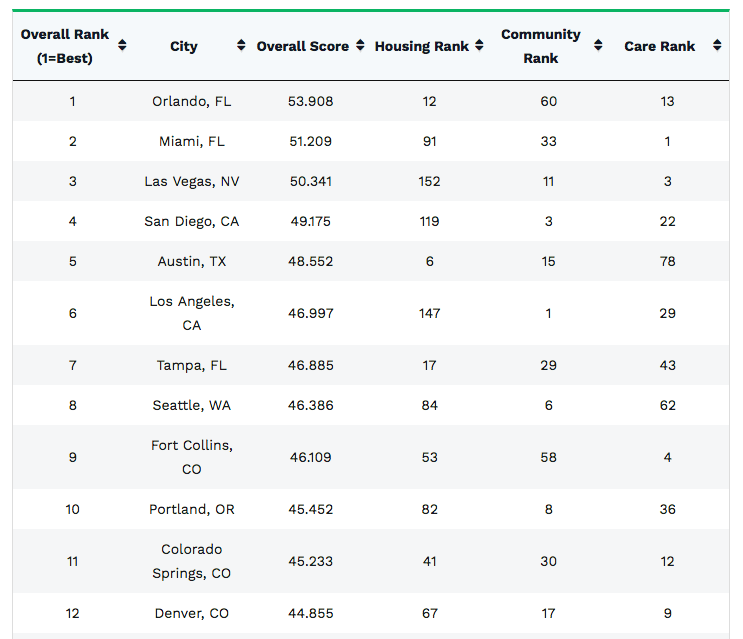
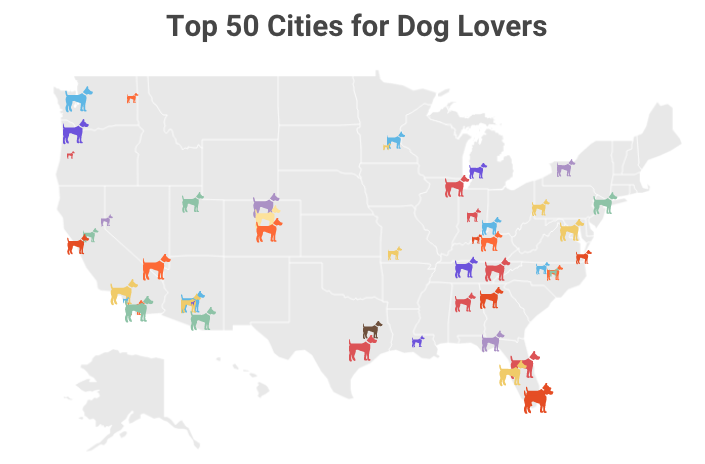
San Diego is the No. 4 Best City for Dog Lovers
 Our dogs love us unconditionally, but how well do our local communities reciprocate that love to our BFFs (Best Furry Friends)? To mark National Dog Day on Aug. 26, LawnStarter sniffed out 2022’s Best Cities for Dog Lovers.
How does San Diego stack up?
San Diego’s Rank in Some Key Metrics (1st = Best)
- Share of Dog-Friendly Rental Properties – 93rd
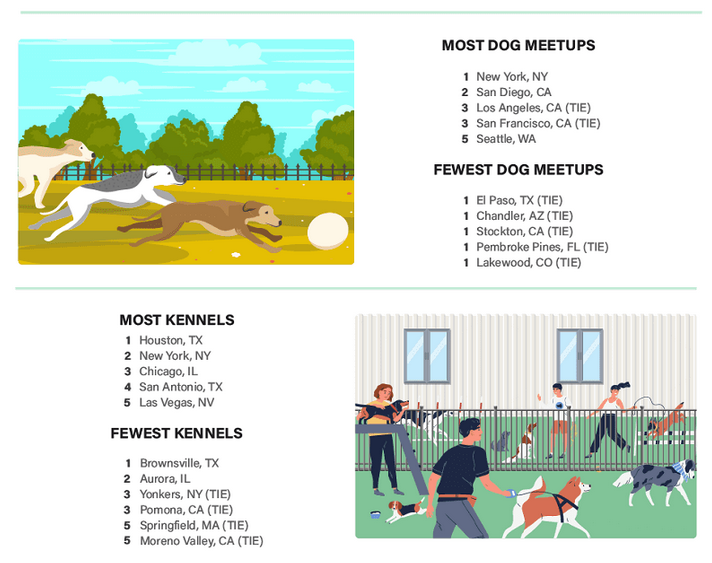
- Number of Dog Meetups – 2nd
- Emergency Veterinary Clinics and Hospitals – 4th
- Number of Kennels – 16th
- Number of Dog-Friendly Accomodations – 1st
- Average Per-Visit Dog Sitter Rate (Income-Adjusted) – 30th
LawnStarter measured the puppy love in nearly 175 of the biggest U.S. cities based on 24 key indicators of dog-friendliness, such as housing, services, and care. LawnStarter also looked at pawlicy favorability, access to pup-welcoming businesses, and affordability.
Check out the leaders of the pack (and the runts of the litter) in the ranking below, followed by some highlights and lowlights.
Highlights and Lowlights
Good Dog, Bad Dog
Turns out dogs and cats can happily coexist — as long as they live in the right city. The Best and Worst Cities for Dog Lovers (Orlando, Florida, and Detroit, respectively) are also this year’s furrendliest and least friendly toward Cat Lovers.
Despite dog- and cat-specific factors making up each study, it’s clear The City Beautiful has a thriving service industry for both types of pets, while The D — sadly not an acronym for “dog-friendly” — is sorely lacking for either.
Orlando leads the pack in pet caretakers, boarding options, and pet stores. That’s expected of a city frequented by tourist families toting their four-legged relatives. Ironically, these families visit to meet Disney’s most famous dogs, Goofy and Pluto — and drop off their own with the sitters.
On the other paw, Detroit missed the mark across all categories, landing near the bottom of almost every indicator. While Motown has plenty to offer your visiting BFF, it’s perhaps not the best city for a furmanent address.
Last year’s No. 1 was Hollywoo(f), Florida, and in last place was New York. Orlando displaced 2021’s winner by significantly improving its dog-friendly housing and care stats. Detroit unseated the Big Apple due to dismal performance in new Affordability metrics.
Homeward (South)bound
The overwhelming majority of The top 50 cities for dog-friendly housing is located in the American South.
Texas has the edge, claiming four of the top 10 spots. Zooming in, Frisco is most generous with indoor space at an average of over 3,000 square feet, while Macon, Georgia, boasts the biggest yards, averaging nearly 20,000 square feet of roving room for Bailey.
If you’re not ready to buy a home, competition for pup-welcoming rentals will be minimal in Tampa, Florida.
Steer clear of cities like Honolulu, New York, Philadelphia, and Boston if you and your pooch are claustrophobic. San Francisco also counts among those to avoid for housing, which is ironic for a city with more dogs than children.
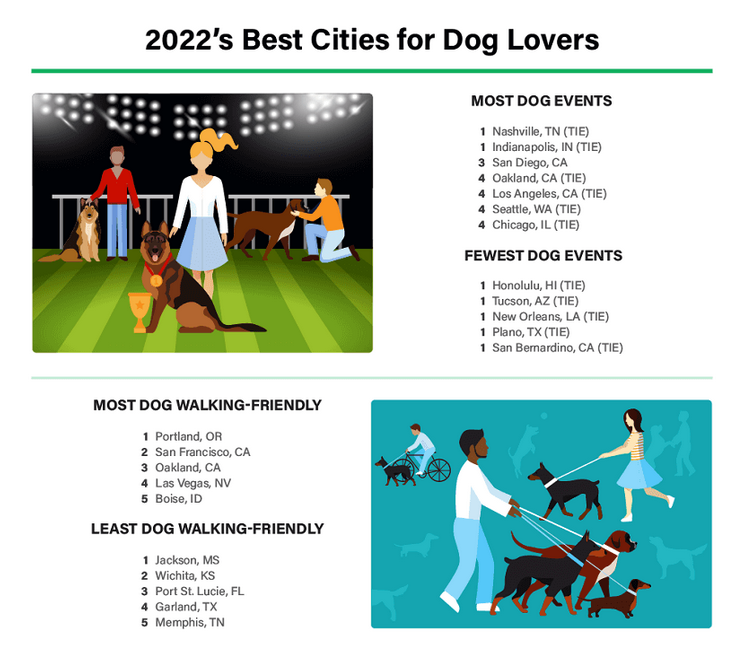
Who Let the Dogs Out?
When you have a furry best pal who loves your company, you want to do everything together — even shopping, eating out, traveling, and getting your hair done.
It’s easy to give your pooch the royal treatment in cities like Austin, Miami, and Seattle. Here, dogs are considered part of the population, so opportunities to kick it with your four-legged companion come aplenty. These cities spoil both pups and their parents with abundant dog-friendly restaurants, shopping centers, and hotels.
Don’t stray into Los Angeles suburbs, though. Let your dog out in the fringes of this metro, and Clifford might just run off to dog haven LA (No. 6 overall). Lancaster, San Bernardino, and Pomona, for example, make up a big chunk of the Businesses category’s worst end due to a lack of woof-worthy options.
Surprising Findings
Small-Dog Cities, Top-Dog Costs
Believe it or not, the most expensive cities to live in general are not the least affordable for dog ownership.
Washington, Seattle, and San Francisco, for example, are three of the spendiest U.S. cities yet rank 12th, 13th, and 14th, respectively, in the Affordability category. By contrast, Detroit, Cleveland, and Jackson, Mississippi, cities with far lower cost of living, number among the worst for Affordability.
Inflation feels like a tight financial collar around everyone’s neck right now but especially lower-income earners’ in cities like Detroit.
To be fair, the wealthiest families in cities like Seattle skew the local average income data, giving the illusion that more people can afford higher costs, including those for dog services. Even well-paid earners are turning to Walmart for cheaper supplies these days.
Western Medicine
If your pup is constantly sick, you’d be in luck living in the Western half of the country.
In Las Vegas, Tucson, Arizona, and Fort Collins, Colorado, for example, canine health is top of mind. Each of these cities boasts the best access to dog health services, including vets, emergency animal hospitals, and general animal clinics.
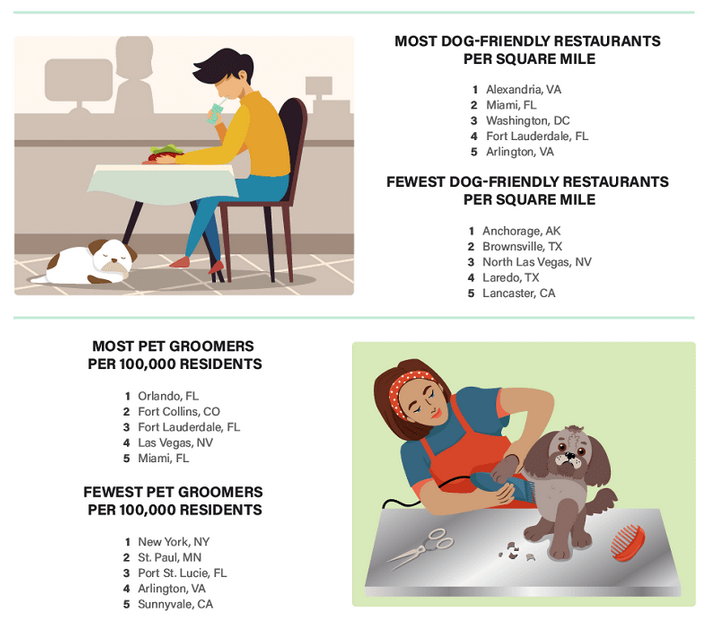
If Spot is in good health, however, Miami and Santa Rosa, California, are ideal cities for your pup. These cities offer some of the most pet stores within easy reach for everyday needs, as well as plenty of vets and emergency animal hospitals.
Behind the Ranking
For each of the 200 biggest U.S. cities, LawnStarter gathered publicly available data on the factors listed in the table below.
LawnStarter then grouped those factors into six categories: Housing, Community, Care, Services, Businesses, and Affordability.
Next, LawnStarter calculated weighted scores for each city in each category.
Finally, LawnStarter averaged the scores for each city across all categories. LawnStarter eliminated 26 cities lacking sufficient data in a single category, resulting in a total sample size of 174 cities.
The city that earned the highest average score was ranked “Best” overall (No. 1), while the city with the lowest was ranked “Worst” overall (No. 174). (Note: The “Worst” among individual factors may not be 174 due to ties.)